Save Energy Globally by Visualizing power use : Enimas solution
ENIMAS Co., Ltd.

Visualize Power Consumption, Costs, and CO2 Emissions with Our IoT Sensors and Mobile App
Most factories can only track total power usage per facility, leaving the specific consumption of individual machines and production lines in the dark. To implement effective reduction strategies, you must first visualize exactly which equipment is driving up costs.
Power consumption fluctuates constantly. It is critical to analyze trends on a daily, weekly, and yearly basis to pinpoint inefficiencies. Only by accurately grasping the operating status of each individual asset can you formulate a truly effective energy-saving plan.
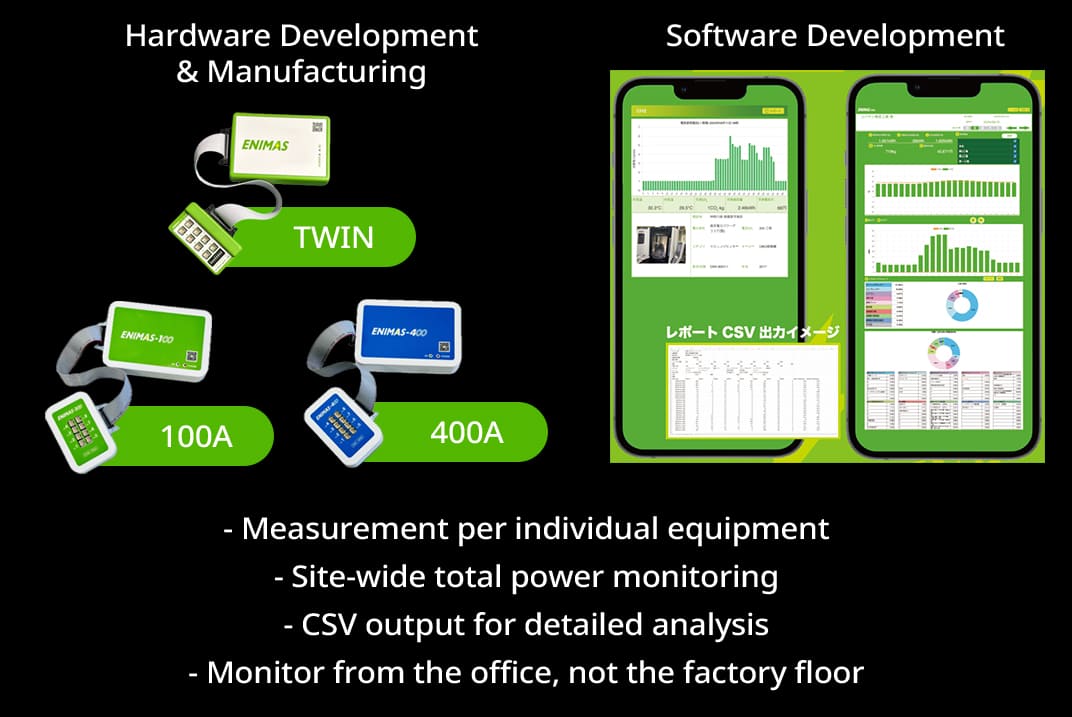
ENIMAS solves this with portable communication ammeters and a smartphone app that visualize power usage, electricity costs, and CO2 emissions at the individual equipment level.
Unified Power Management Across All Sites. Identify Reduction Points 24/7 with a Simple Web App.
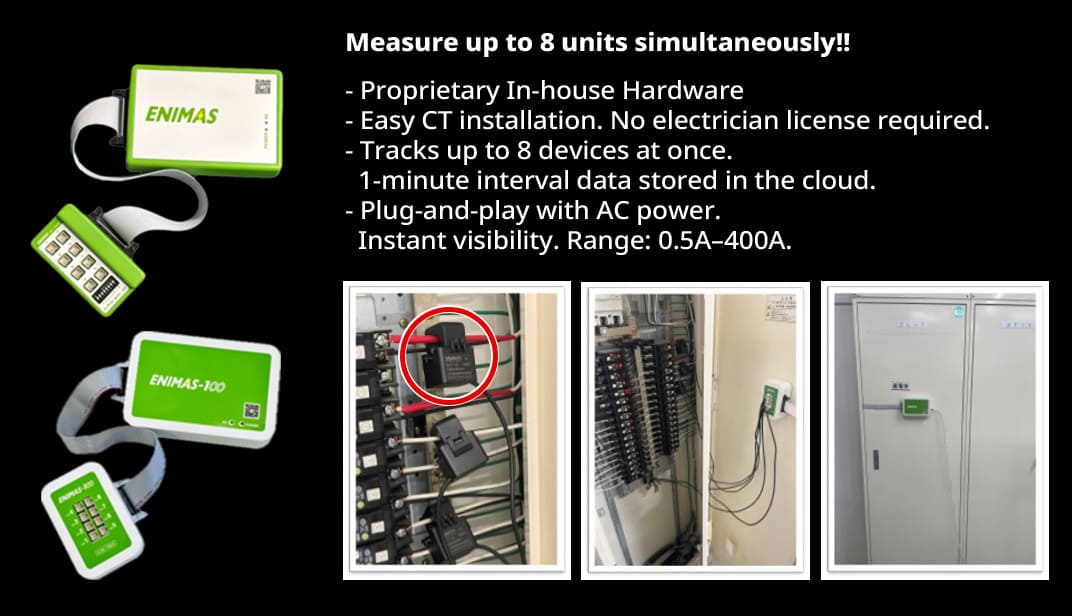
Simply attach clamp sensors to breakers in your distribution board to measure current across 8 circuits. Data is transmitted to the cloud every minute via 4G, providing real-time visibility into power usage, costs, and CO2 emissions on our dedicated app. Data can also be exported as CSV files for deeper analysis.
Our installation-free Web App allows you to view data instantly on any smartphone or tablet, anytime, anywhere. With the integrated software ENIMAS-PRO, you can visualize and manage power conditions across scattered nationwide locations on a single dashboard. This enables managers to check the status of all departments 24/7 without needing to visit sites in person.
For secure communication, we use SORACOM's globally proven 4G LTE SIM cards. By implementing device authentication and secure protocol conversion, we ensure robust cybersecurity that prevents any data leakage to the outside world.
Easy Installation: No Wiring Work, No Downtime.
Install effortlessly without the need for electrical wiring work or factory shutdowns. Installation is possible even while your factory is in full operation.
There are no complicated settings after installation. Simply power on the ENIMAS unit, and it immediately begins displaying real-time data on power usage, electricity costs, and CO2 emissions.
There are no complicated settings after installation. Simply power on the ENIMAS unit, and it immediately begins displaying real-time data on power usage, electricity costs, and CO2 emissions.

Client Success Stories
・Manufacturing Client 1
By aggregating data by usage purpose, we identified high heating and cooling costs. We optimized our workplace environment to reduce reliance on HVAC, successfully cutting annual power consumption by 20%.
・Manufacturing Client 2
Monitoring electricity fluctuations during factory operation revealed a transformer running unnecessarily for 24 hours. Installing a breaker resulted in annual savings of 400,000 yen.
・Restaurant Industry Client
We compared power usage between company-owned stores and franchises to demonstrate potential savings from equipment upgrades, allowing us to make data-driven proposals to franchise owners.
・Social Implementation Track Record
- Concluded an agreement on the implementation of electricity visualization for the Sagamihara City Hall Main Building.
- Adopted by Kawasaki City's "Power Visualization Support" program for local businesses.